The Coastal portal visualizes changes in shipping density during the corona crisis
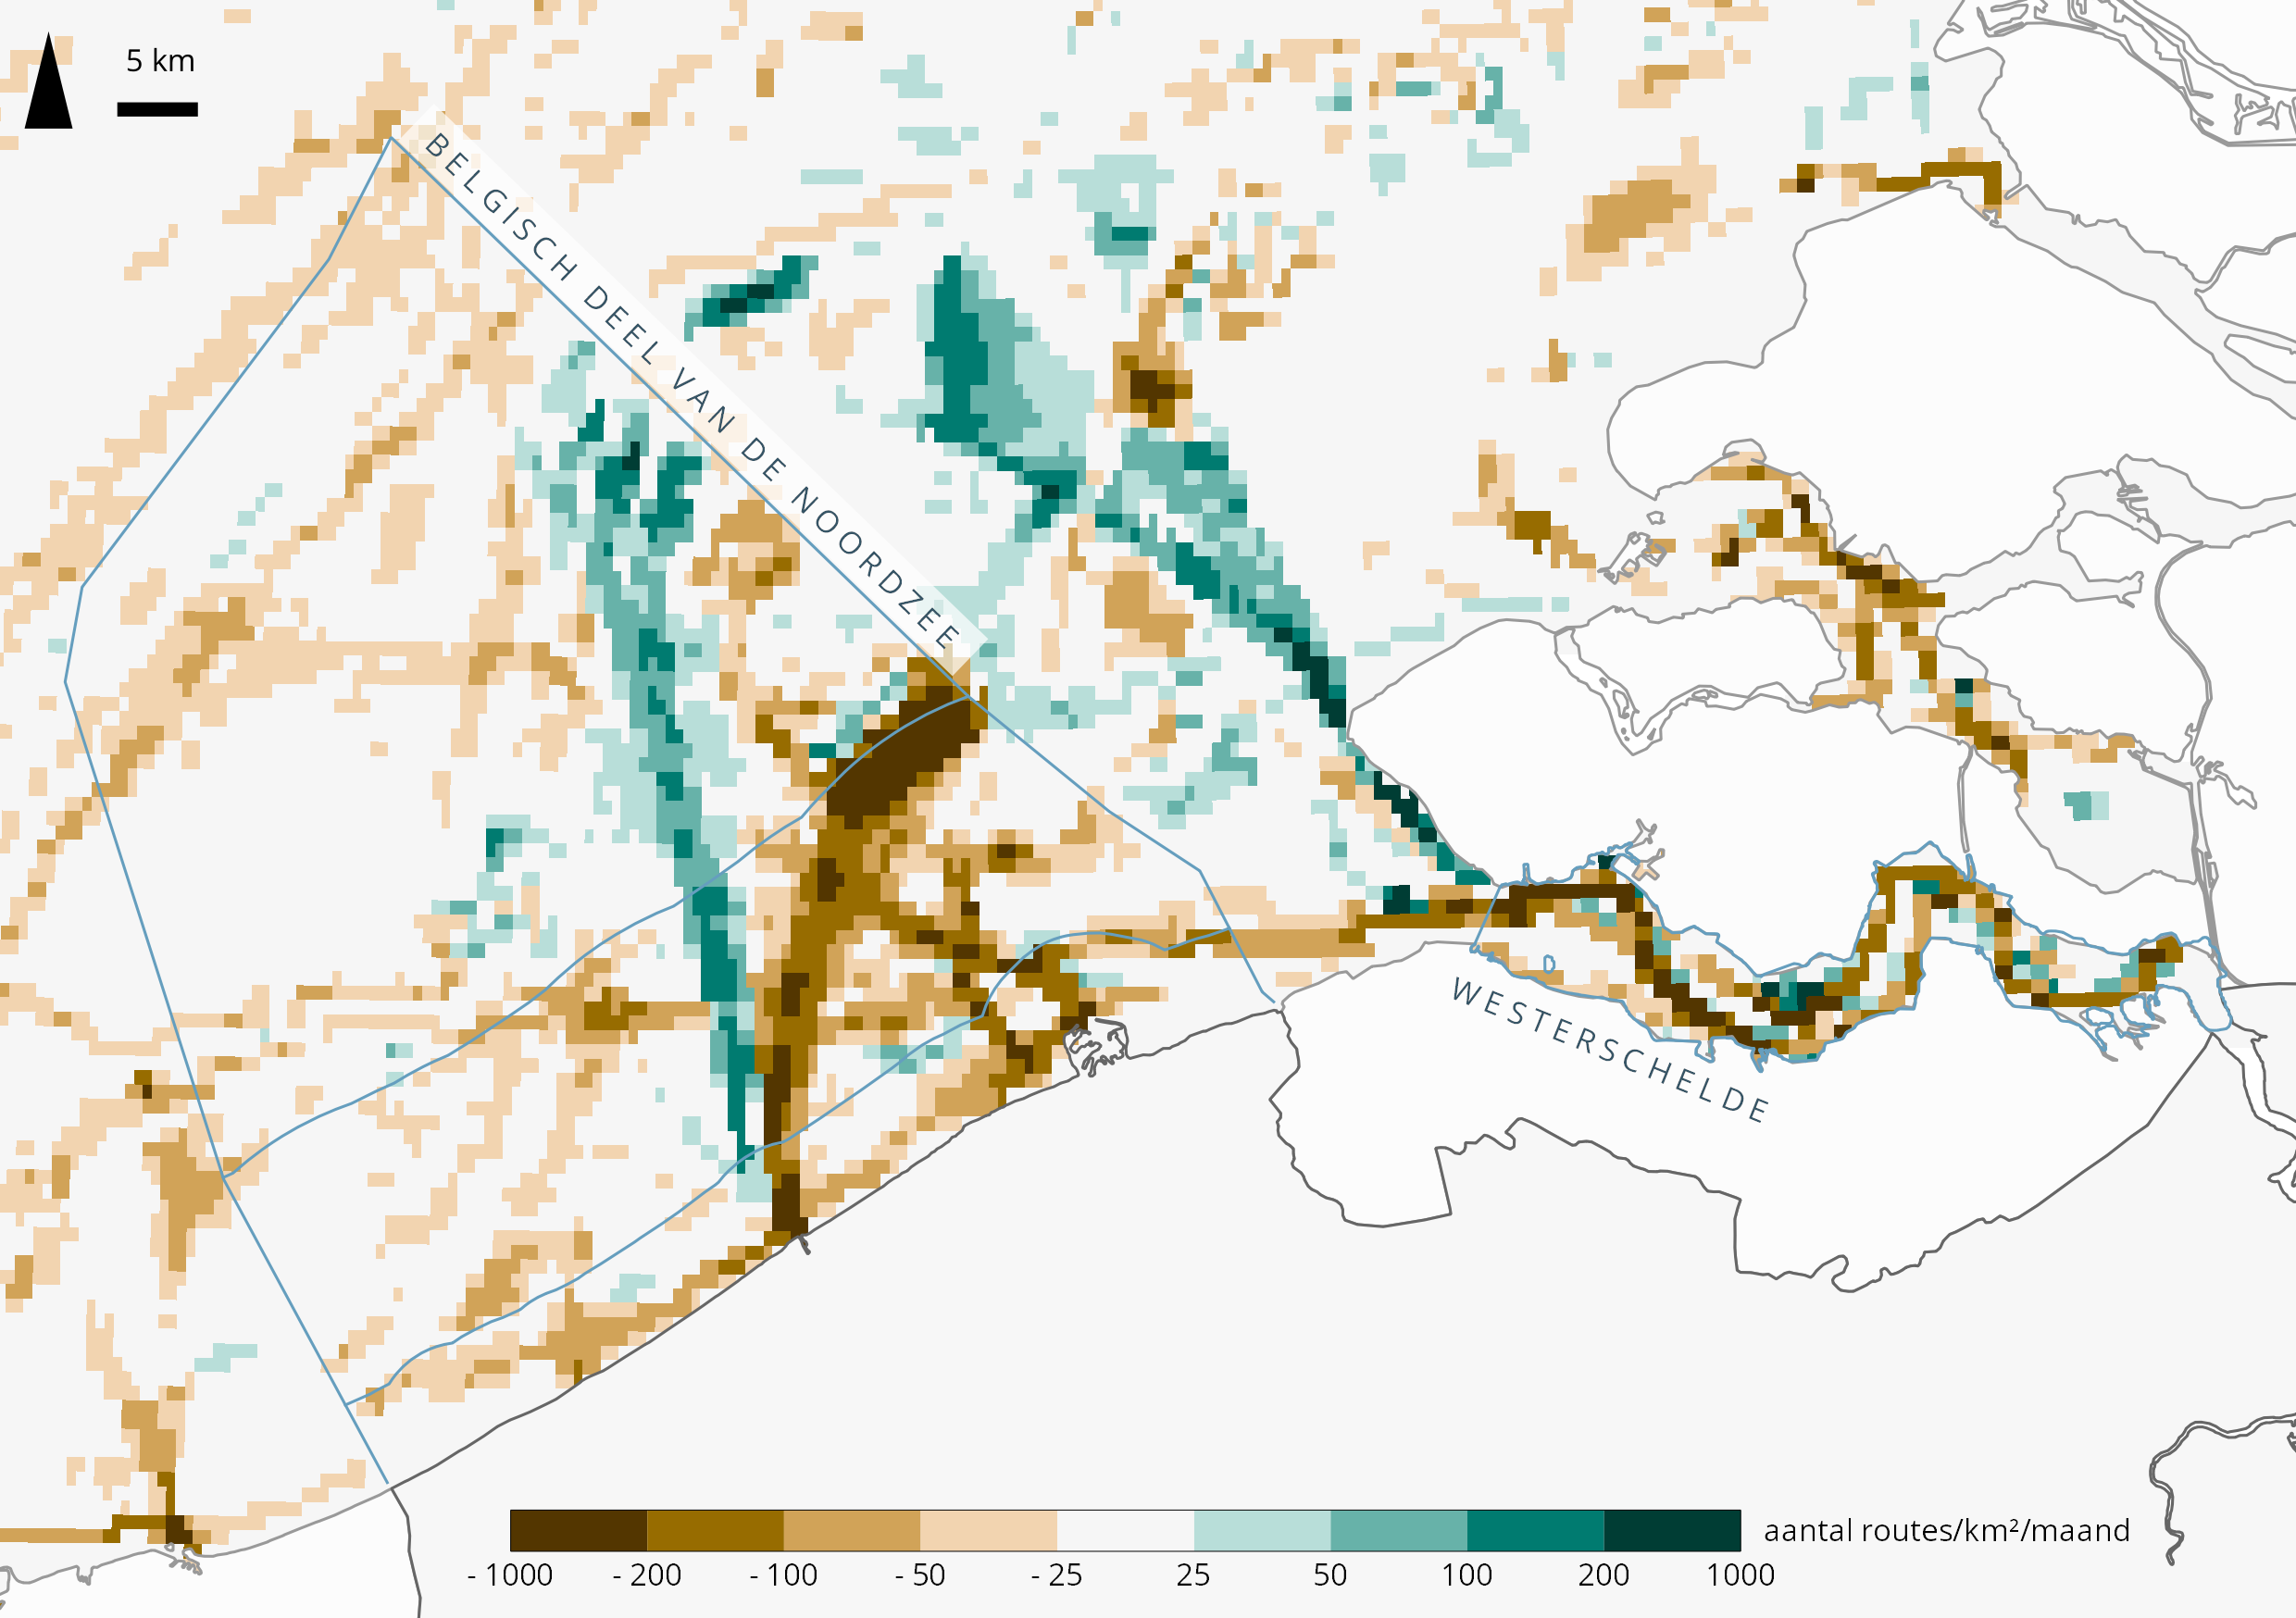
A new study by VLIZ, based on open data (EMODnet Human Activities portal), reveals a decrease in shipping activity in the Belgian part of the North Sea (BPNS) and the Western Scheldt (WS) in the period 'February-April' 2020 versus 2019.. This decrease is at least partly related to the coronavirus and is mainly reflected among cargo vessels (BPNS -11.8%; WS -5.5%), passenger vessels (BPNS -34.1%; WS -38.5%) and fishing vessels (BPNS -33.3%; WS -9.6%). In the BPNS, due to a large number of calls in the port of Zeebrugge in February, tankers show a slightly positive trend (+0.9%), while a limited reduction of -1.2% is observed in the Western Scheldt. Furthermore, a decrease in tugboat activity is observed that is only reflected in the Western Scheldt and is inextricably linked to the decreasing cargo and (to a lesser extent) tanker activity compared to the reference period.
For fisheries in the BPNS (mainly foreign vessels), some large-scale changes occurred in the spring of 2020 compared to the spring of 2019 that make it difficult to estimate the effective impact of the coronavirus. For example, a ban on pulse fishing in the Belgian territorial sea (12 nautical mile zone) has been in force since 14 August 2019 and the Borssele wind farm in Dutch waters (adjacent to the BNZ) was closed to fishing from 28 September 2019 onwards. Nevertheless, the crisis has a clear effect on the trade of fresh fish landed by Belgian fishing vessels, due to a falling demand (e.g. catering closure) and reduced exports. The vessels involved in survey, maintenance and construction works of offshore wind farms, in turn, show no decrease in activity related to the coronavirus, but appear to have been affected by the harsh weather conditions in January and February of this year.
In conclusion, the aggregated open AIS data (density data) allows linking the variations in shipping traffic to specific events (e.g. corona, weather conditions, construction of offshore wind farms, etc.). In particular, the density maps prove to be a powerful tool for detecting high-resolution changes that can be attributed to concrete measures (e.g. reducing the activity of a particular ferry line).
The full report can be downloaded here. The data analysis scripts have been made available here while a selection of the maps can be consulted on the Coastal Portal.